安装 Glances、InfluxDB 和 Grafana 来监控 CentOS 7
Glances 是一款免费开源、现代化、跨平台、实时 top 和类 htop 的监控工具,具有先进的功能。它可以在不同的模式下运行:独立运行、客户端/服务器模式和 Web 服务器模式。
InfluxDB 是一个开源且可扩展的时间序列数据库,用于指标、事件和实时分析。
Grafana 是一款开源、功能丰富、功能强大、优雅且高度可扩展的跨平台工具,用于监控和指标分析,具有美观且可定制的仪表板。它是事实上的数据分析软件。
在本文中,我们将解释如何安装和配置 Glances、InfluxDB 和 Grafana 来监控 CentOS 7 的性能强>服务器。
步骤1:在CentOS 7中安装Glances
1. 首先使用 PIP 安装最新稳定版本的 glances (v2.11.1)。如果您没有pip,请按如下方式安装,包括安装psutil所需的Python-headers。
yum install python-pip python-devel
2.一旦您拥有PIP和Python-headers,请运行以下命令来安装glances的最新稳定版本并验证版本。
pip install glances
glances -V

Glances v2.11.1 with psutil v5.4.7
或者,如果您已经安装了glances,则可以使用以下命令将其升级到最新版本。
pip install --upgrade glances
3. 现在您需要通过 systemd 启动浏览器,以便它作为服务运行。通过在 /etc/systemd/system/ 中创建名为 glances.service 的文件来创建一个新单元。
vim /etc/systemd/system/glances.service
将以下配置复制并粘贴到文件 glances.service 中。 --config 指定配置文件,--export-influxdb 选项告诉 Glass 将统计数据导出到 InfluxDB 服务器,--disable-ip 选项禁用 IP 模块。
[Unit]
Description=Glances
After=network.target influxd.service

[Service]
ExecStart=/usr/bin/glances --config /home/admin/.config/glances/glances.conf --quiet --export-influxdb --disable-ip
Restart=on-failure
RestartSec=30s
TimeoutSec=30s

[Install]
WantedBy=multi-user.target
保存文件并关闭它。
4.然后重新加载systemd管理器配置,启动glances服务,查看其状态,并使其在启动时自动启动。
systemctl daemon-reload
systemctl start glances.service
systemctl status glances.service
systemctl enable glances.service
5.接下来,您需要使用wget命令下载开发者提供的glances配置文件,如图所示。
mkdir ~/.config/glances/
wget https://raw.githubusercontent.com/nicolargo/glances/master/conf/glances.conf -P ~/.config/glances/
6. 为了将 Glances 统计数据导出到 InfluxDB 数据库,您需要 Python InfluxdDB 库,您可以使用该库可以使用pip命令安装。
sudo pip install influxdb
步骤2:在CentOS 7中安装InfluxDB
7. 接下来,您需要添加 InfluxDB Yum 存储库来安装最新版本的 InfluxDB 软件包,如图所示。
cat <<EOF | sudo tee /etc/yum.repos.d/influxdb.repo
[influxdb]
name = InfluxDB Repository - RHEL $releasever
baseurl = https://repos.influxdata.com/rhel/$releasever/$basearch/stable
enabled = 1
gpgcheck = 1
gpgkey = https://repos.influxdata.com/influxdb.key
EOF
8. 将存储库添加到 YUM 配置后,通过运行安装 InfluxDB 包。
yum install influxdb
9. 接下来,通过systemd启动InfluxDB服务,通过查看其状态确认其正在运行,并使其在系统启动时自动启动。
systemctl start influxdb
systemctl status influxdb
systemctl enable influxdb
10.默认情况下,InfluxDB使用TCP端口8086通过InfluxDB的HTTP API进行客户端-服务器通信,您需要使用firewall-cmd在防火墙中打开此端口。
firewall-cmd --add-port=8086/tcp --permanent
firewall-cmd --reload
11.接下来,您需要在InfluxDB中创建一个数据库,用于存储glances中的数据。 InfluxDB 包中包含的 influx 命令是与数据库交互的最简单方法。因此执行influx来启动CLI并自动连接到本地InfluxDB实例。
influx
运行以下命令创建名为 glances 的数据库并查看可用的数据库。
Connected to http://localhost:8086 version 1.6.2
InfluxDB shell version: 1.6.2
> CREATE DATABASE glances
> SHOW DATABASES
name: databases
name
----
_internal
glances
>
要退出 InfluxQL shell,请输入 exit 并按 Enter。
步骤3:在CentOS 7中安装Grafana
12. 现在,从其官方 YUM 存储库安装 Grafana,首先将以下配置添加到 /etc/yum.repos.d/grafana.repo强> 存储库文件。
[grafana]
name=grafana
baseurl=https://packagecloud.io/grafana/stable/el/7/$basearch
repo_gpgcheck=1
enabled=1
gpgcheck=1
gpgkey=https://packagecloud.io/gpg.key https://grafanarel.s3.amazonaws.com/RPM-GPG-KEY-grafana
sslverify=1
sslcacert=/etc/pki/tls/certs/ca-bundle.crt
13. 将存储库添加到 YUM 配置后,通过运行安装 Grafana 软件包。
yum install grafana
14.安装Grafana后,重新加载systemd管理器配置,启动grafana服务器,通过查看其状态来检查服务是否已启动并正在运行,并使其能够自动启动在引导时启动。
systemctl daemon-reload
systemctl start grafana-server
systemctl status grafana-server
systemctl enable grafana-server
15. 接下来,使用firewall-cmd 在防火墙中打开 Grafana 服务器侦听的端口 3000。
firewall-cmd --add-port=3000/tcp --permanent
firewall-cmd --reload
步骤 4:通过 Grafana 监控 CentOS 7 服务器指标
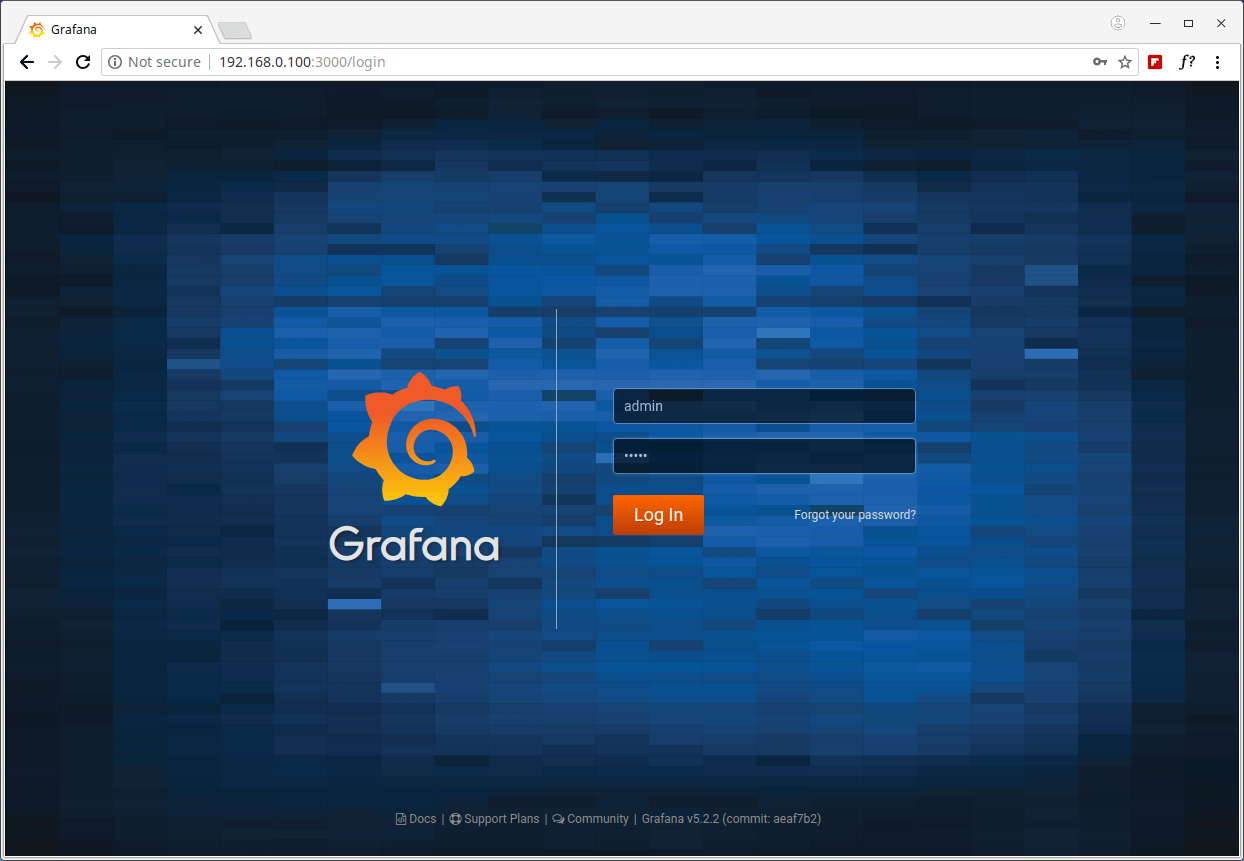
16. 此时,您可以使用以下 URL 访问 Grafana Web 界面,该界面将重定向到登录页面,使用默认凭据登录。
URL: http://SERVER_IP:3000
Username: admin
Password: admin
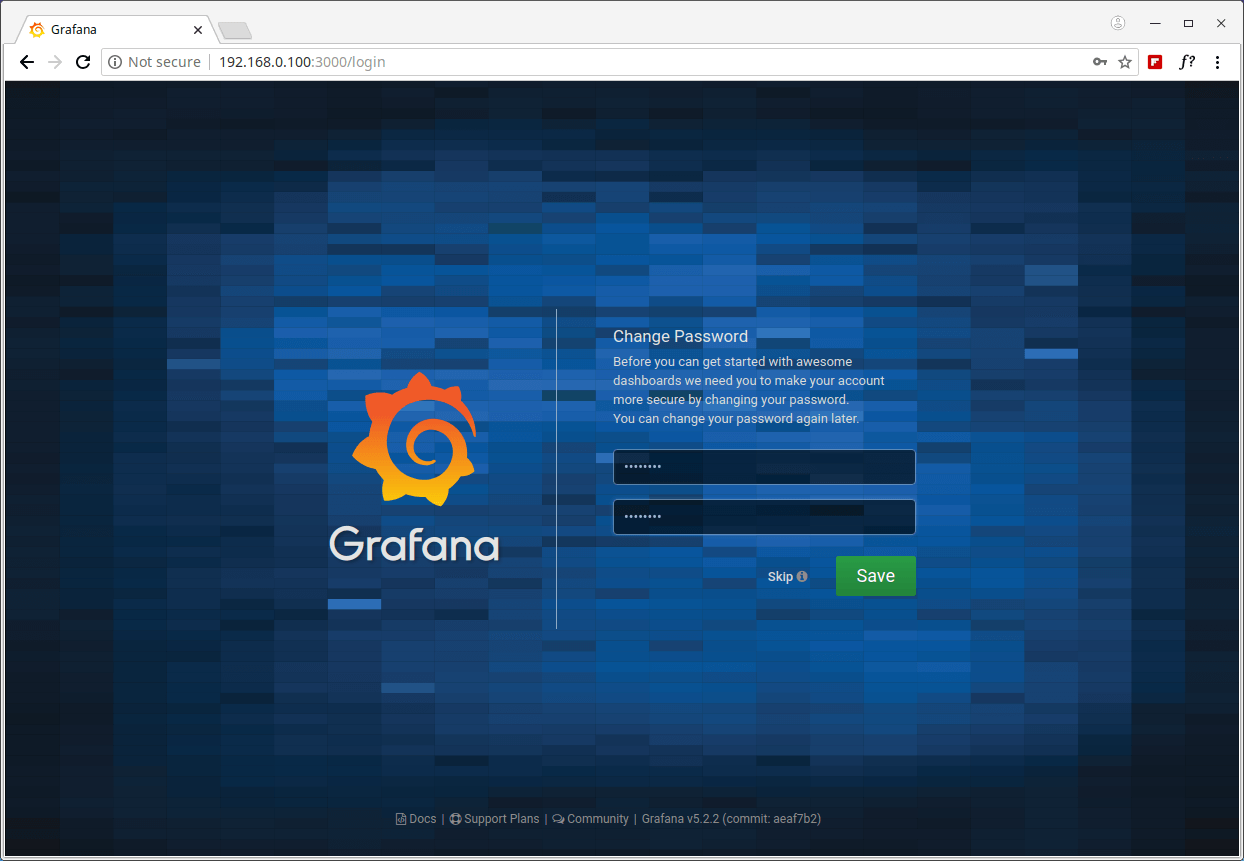
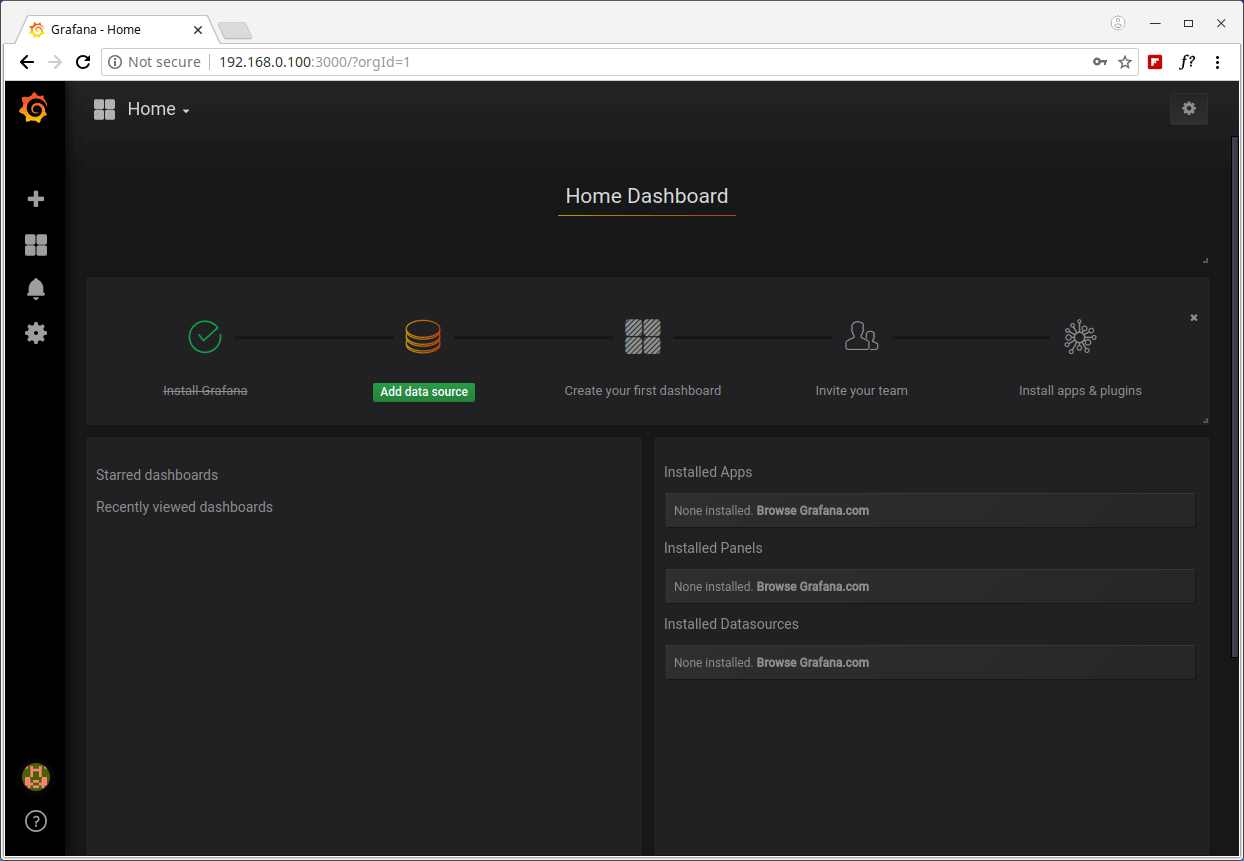
系统将要求您创建一个新密码,完成后,您将被重定向到主页仪表板,如下面的屏幕截图所示。
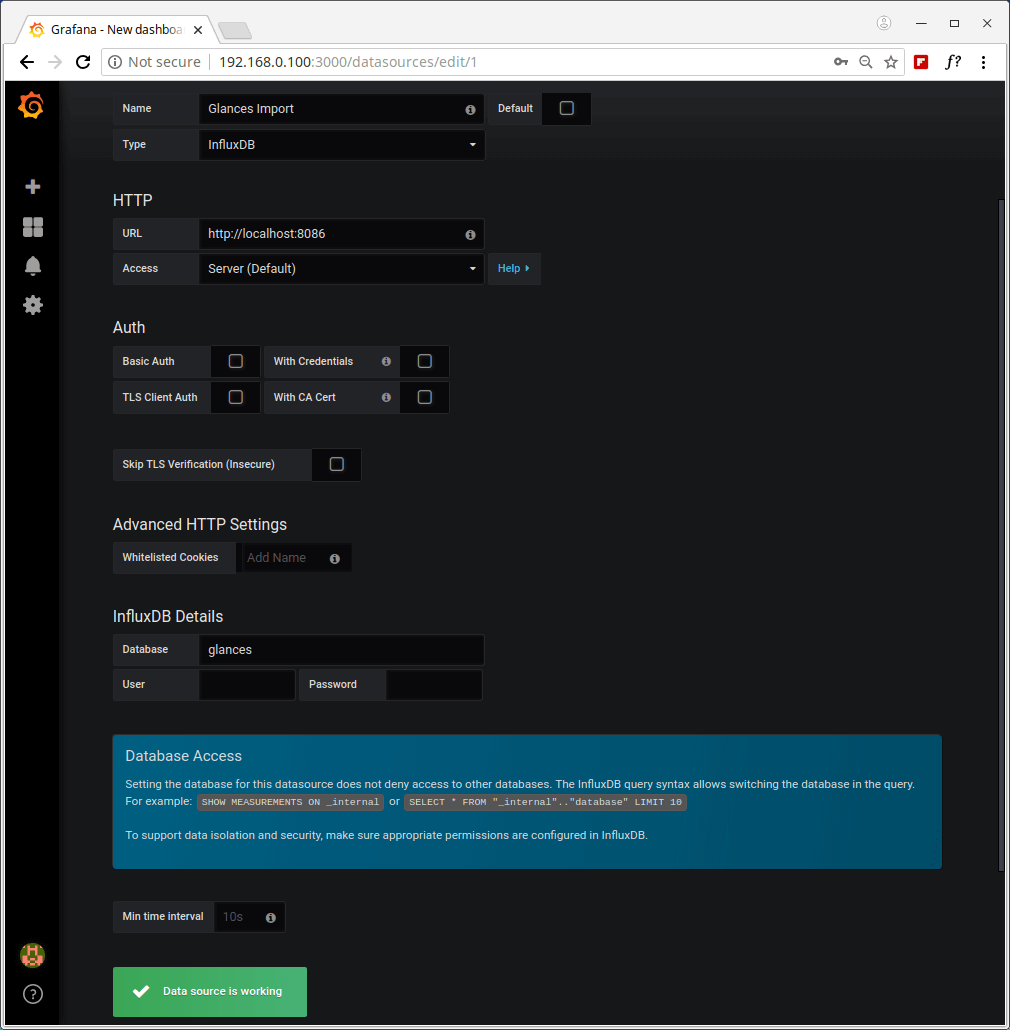
17. 接下来,单击创建您的第一个数据源,该数据源应该是 InfluxDB 数据库。在设置下,输入合适的名称,例如Glances Import,然后对其他两个重要变量(HTTP URL 和 InfluxDB 数据库)如屏幕截图所示。
HTTP URL: http://localhost:8086
InfluxDB Details - Database: glances
然后单击保存并测试连接到数据源。您应该收到一条反馈,指示“数据源正在运行”。
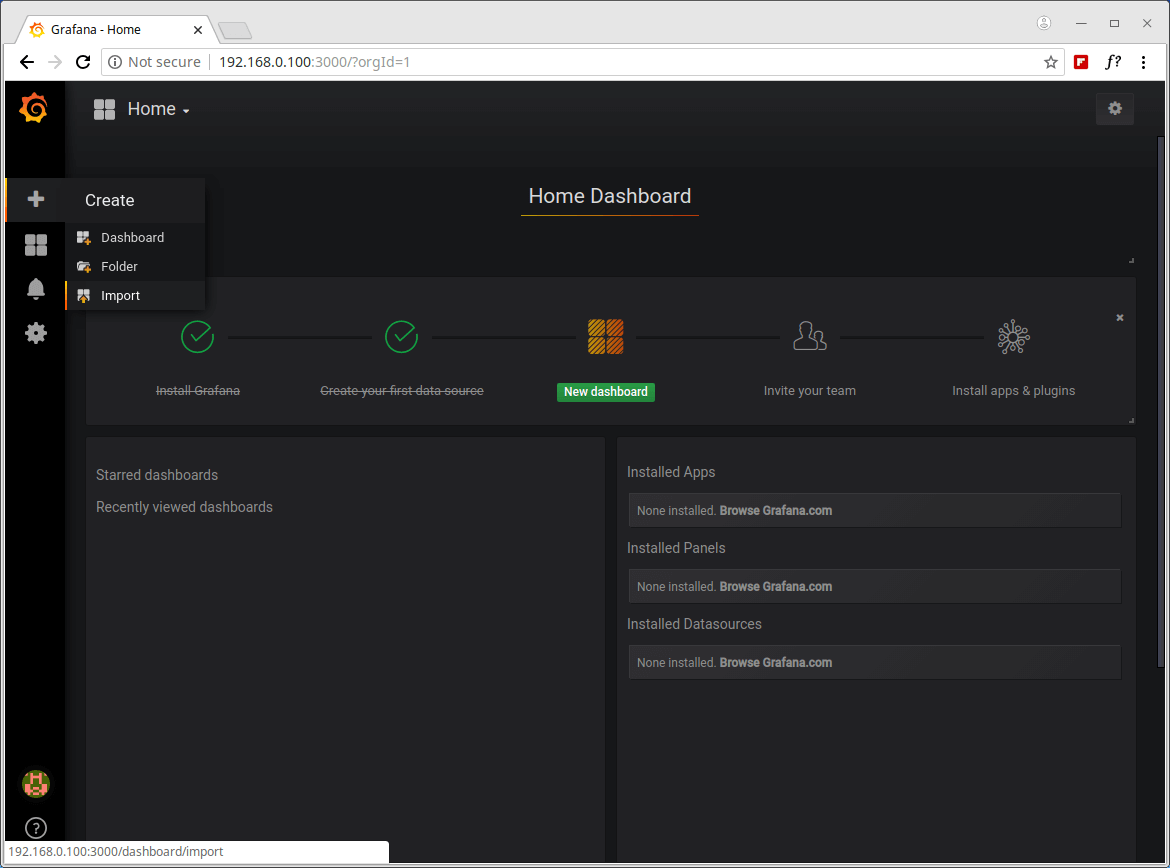
18.现在您需要导入Glances仪表板。单击加号 (+) 并转到导入,如屏幕截图所示。
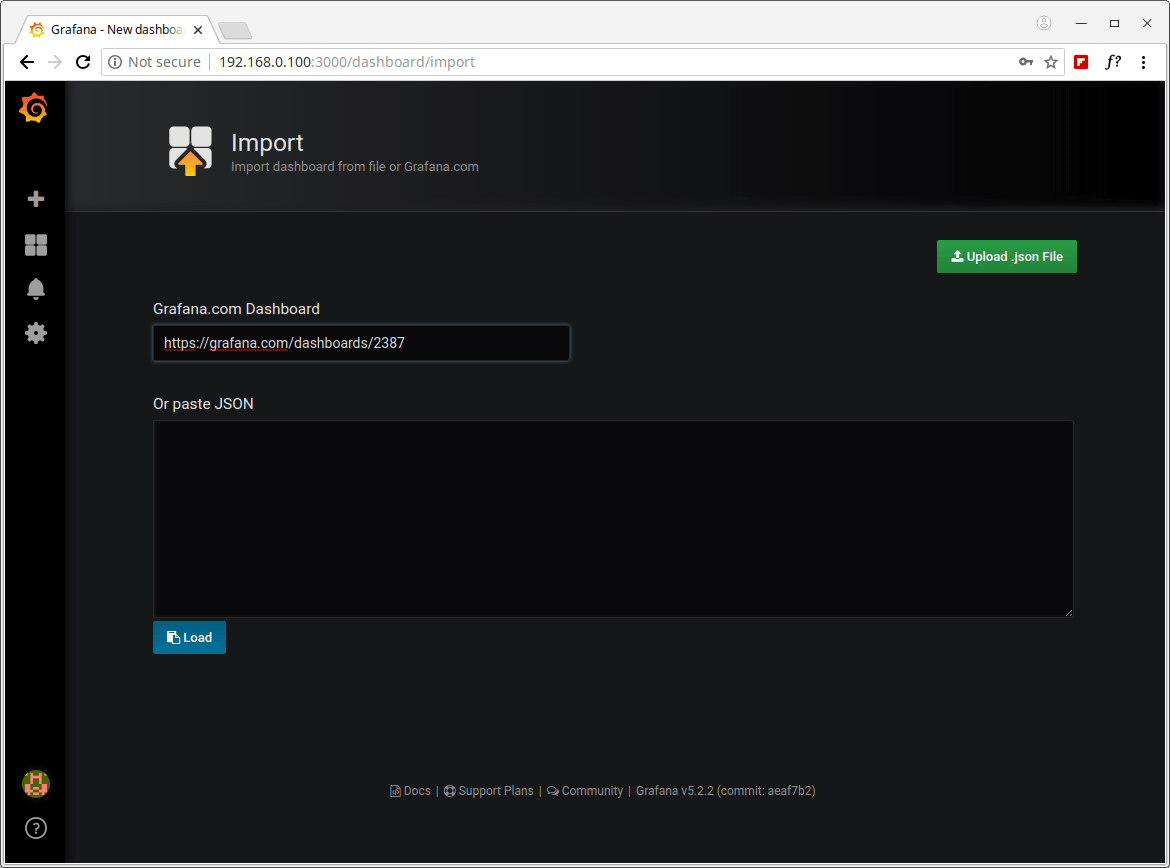
17. 您将需要 Glances Dashboard URL 或 ID,或者上传其 .JSON 文件,您可以从 Grafana.com 找到该文件。在本例中,我们将使用 Glances 开发者创建的 Glances Dashboard,其 URL 为 https://grafana.com/dashboards/2387 或 ID 为 >2387。
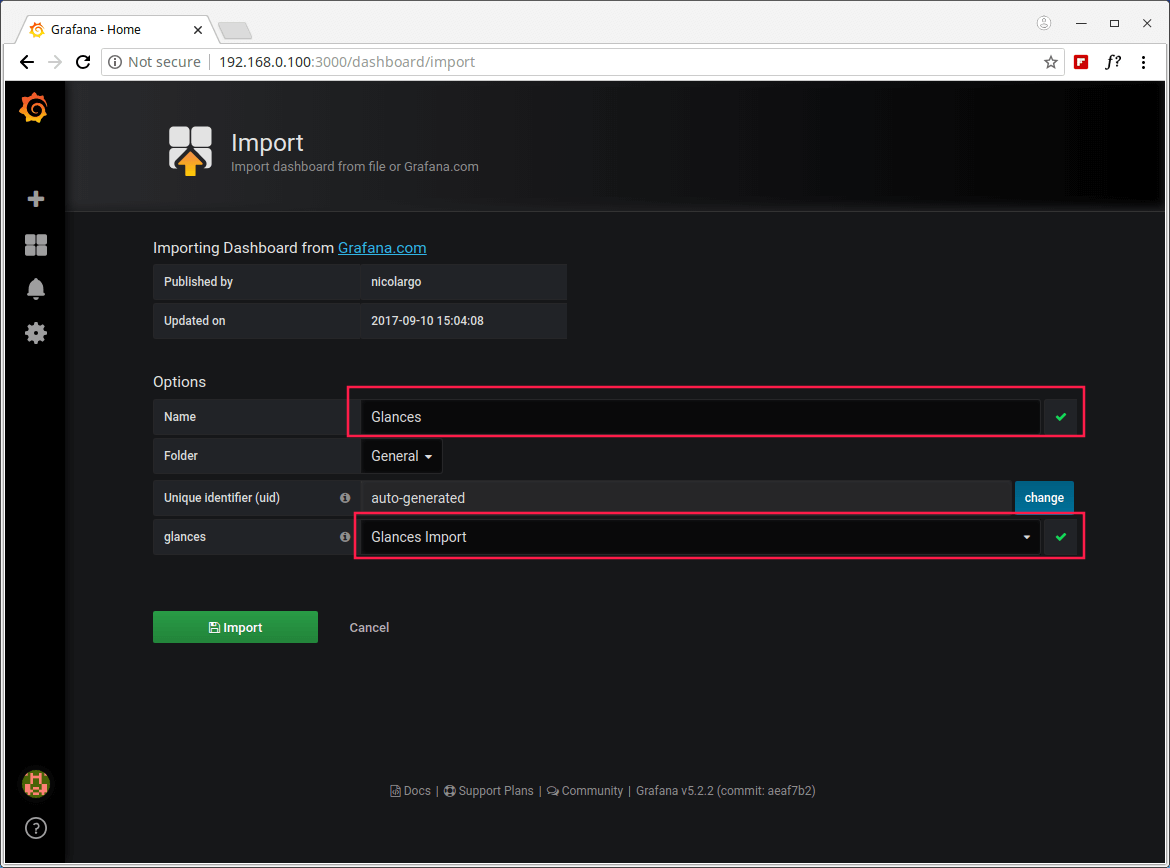
18. 加载 Grafana 仪表板后,在选项下找到 Glances 并选择您之前创建的 InluxDB 数据源 (Glances Import),然后单击 导入,如下面的屏幕截图所示。
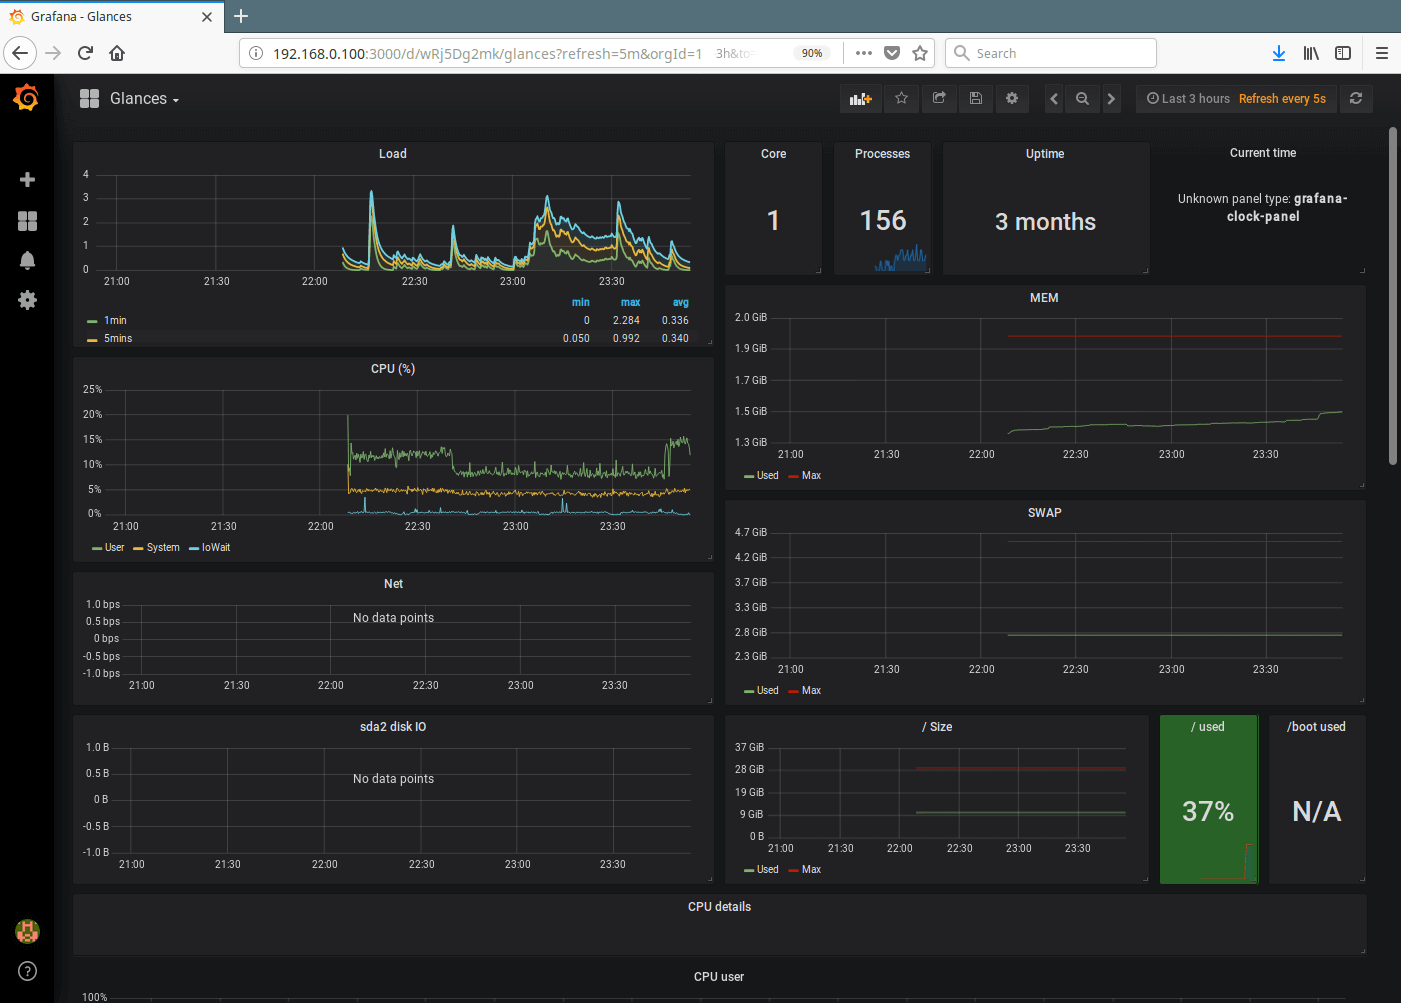
19.成功导入Glances仪表板后,您应该能够观看显示服务器指标的图表,这些图表是由influxdb通过glances提供的。
目前为止就这样了!在本文中,我们解释了如何使用 Glances、InfluxDB 和 Grafana 监控 CentOS 7 服务器。如果您有任何疑问或需要分享信息,请使用下面的评论表进行分享。