在 Debian 11|10 上安装 Prometheus 和 node_exporter
如何在 Debian 11 上安装 Prometheus| Debian 10 Linux? Prometheus 是一个免费的开源监控系统,使您能够从任何目标系统收集时间序列数据指标。其 Web 界面使您能够执行强大的查询、可视化收集的数据以及配置警报。
在本指南中,我们将介绍在 Debian 11/Debian 10 上安装 Prometheus 和 node_exporter。由于这是二进制安装方法,因此不需要依赖项即可继续安装。
步骤1:创建Prometheus系统用户/组
我们将创建一个专用的 Prometheus 系统用户和组。 -r 或 -system 选项用于此目的。
sudo groupadd --system prometheus
sudo useradd -s /sbin/nologin --system -g prometheus prometheus
这将创建一个不需要 /bin/bash shell 的系统用户,这就是我们使用 -s /sbin/nologin 的原因。
第2步:创建配置和数据目录
Prometheus 需要目录来存储数据和配置文件。使用以下命令创建所有必需的目录。
sudo mkdir /var/lib/prometheus
for i in rules rules.d files_sd; do sudo mkdir -p /etc/prometheus/${i}; done
第 3 步:下载并安装 Prometheus Debian 11/Debian 10
让我们下载最新版本的 Prometheus 存档并将其解压以获取二进制文件。您可以从 Prometheus 版本 Github 页面查看版本。
sudo apt-get update
sudo apt-get -y install wget curl
mkdir -p /tmp/prometheus && cd /tmp/prometheus
curl -s https://api.github.com/repos/prometheus/prometheus/releases/latest|grep browser_download_url|grep linux-amd64|cut -d '"' -f 4|wget -qi -
提取文件。
tar xvf prometheus*.tar.gz
cd prometheus*/
将 prometheus 二进制文件移动到 /usr/local/bin/
由于/usr/local/bin/位于您的PATH中,因此我们将二进制文件复制到其中。
sudo mv prometheus promtool /usr/local/bin/将 prometheus 配置模板移动到 /etc 目录。
sudo mv prometheus.yml /etc/prometheus/prometheus.yml同时将控制台和 console_libraries 移动到 /etc/prometheus 目录:
sudo mv consoles/ console_libraries/ /etc/prometheus/
cd ~/
rm -rf /tmp/prometheus
步骤 4:创建/编辑 Prometheus 配置文件。
Prometheus 配置文件将位于 /etc/prometheus/prometheus.yml 下。
cat /etc/prometheus/prometheus.yml默认配置文件如下所示。
# my global config
global:
  scrape_interval:     15s # Set the scrape interval to every 15 seconds. Default is every 1 minute.
  evaluation_interval: 15s # Evaluate rules every 15 seconds. The default is every 1 minute.
  # scrape_timeout is set to the global default (10s).

# Alertmanager configuration
alerting:
  alertmanagers:
  - static_configs:
    - targets:
      # - alertmanager:9093

# Load rules once and periodically evaluate them according to the global 'evaluation_interval'.
rule_files:
  # - "first_rules.yml"
  # - "second_rules.yml"

# A scrape configuration containing exactly one endpoint to scrape:
# Here it's Prometheus itself.
scrape_configs:
  # The job name is added as a label `job=<job_name>` to any timeseries scraped from this config.
  - job_name: 'prometheus'

    # metrics_path defaults to '/metrics'
    # scheme defaults to 'http'.

    static_configs:
    - targets: ['localhost:9090']
第5步:创建Prometheus systemd服务单元文件
为了能够使用 systemd 管理 Prometheus 服务,您需要显式定义此单元文件。
sudo tee /etc/systemd/system/prometheus.service<<EOF
[Unit]
Description=Prometheus
Documentation=https://prometheus.io/docs/introduction/overview/
Wants=network-online.target
After=network-online.target

[Service]
Type=simple
User=prometheus
Group=prometheus
ExecReload=/bin/kill -HUP $MAINPID
ExecStart=/usr/local/bin/prometheus \
  --config.file=/etc/prometheus/prometheus.yml \
  --storage.tsdb.path=/var/lib/prometheus \
  --web.console.templates=/etc/prometheus/consoles \
  --web.console.libraries=/etc/prometheus/console_libraries \
  --web.listen-address=0.0.0.0:9090 \
  --web.external-url=

SyslogIdentifier=prometheus
Restart=always

[Install]
WantedBy=multi-user.target
EOF
更改目录权限。
将这些目录的所有权更改为 Prometheus 用户和组。
for i in rules rules.d files_sd; do sudo chown -R prometheus:prometheus /etc/prometheus/${i}; done
for i in rules rules.d files_sd; do sudo chmod -R 775 /etc/prometheus/${i}; done
sudo chown -R prometheus:prometheus /var/lib/prometheus/
重新加载 systemd 守护进程并启动服务。
sudo systemctl daemon-reload
sudo systemctl start prometheus
sudo systemctl enable prometheus
确认服务正在运行。
$ systemctl status prometheus.service
* prometheus.service - Prometheus
Loaded: loaded (/etc/systemd/system/prometheus.service; enabled; vendor preset: enabled)
Active: active (running) since Mon 2023-05-22 23:42:43 EAT; 19s ago
Docs: https://prometheus.io/docs/introduction/overview/
Main PID: 5790 (prometheus)
Tasks: 6 (limit: 9303)
Memory: 16.5M
CPU: 45ms
CGroup: /system.slice/prometheus.service
`-5790 /usr/local/bin/prometheus --config.file=/etc/prometheus/prometheus.yml --storage.tsdb.path=/var/lib/prometheus --web.console.>
May 22 23:42:43 grafana prometheus[5790]: ts=2023-05-22T20:42:43.219Z caller=tls_config.go:232 level=info component=web msg="Listening on" addres>
May 22 23:42:43 grafana prometheus[5790]: ts=2023-05-22T20:42:43.219Z caller=tls_config.go:235 level=info component=web msg="TLS is disabled." ht>
May 22 23:42:43 grafana prometheus[5790]: ts=2023-05-22T20:42:43.220Z caller=head.go:748 level=info component=tsdb msg="WAL segment loaded" segme>
May 22 23:42:43 grafana prometheus[5790]: ts=2023-05-22T20:42:43.220Z caller=head.go:785 level=info component=tsdb msg="WAL replay completed" che>
May 22 23:42:43 grafana prometheus[5790]: ts=2023-05-22T20:42:43.221Z caller=main.go:1037 level=info fs_type=EXT4_SUPER_MAGIC
May 22 23:42:43 grafana prometheus[5790]: ts=2023-05-22T20:42:43.221Z caller=main.go:1040 level=info msg="TSDB started"
May 22 23:42:43 grafana prometheus[5790]: ts=2023-05-22T20:42:43.221Z caller=main.go:1220 level=info msg="Loading configuration file" filename=/e>
May 22 23:42:43 grafana prometheus[5790]: ts=2023-05-22T20:42:43.221Z caller=main.go:1257 level=info msg="Completed loading of configuration file>
May 22 23:42:43 grafana prometheus[5790]: ts=2023-05-22T20:42:43.222Z caller=main.go:1001 level=info msg="Server is ready to receive web requests>
May 22 23:42:43 grafana prometheus[5790]: ts=2023-05-22T20:42:43.222Z caller=manager.go:995 level=info component="rule manager" msg="Starting rul>
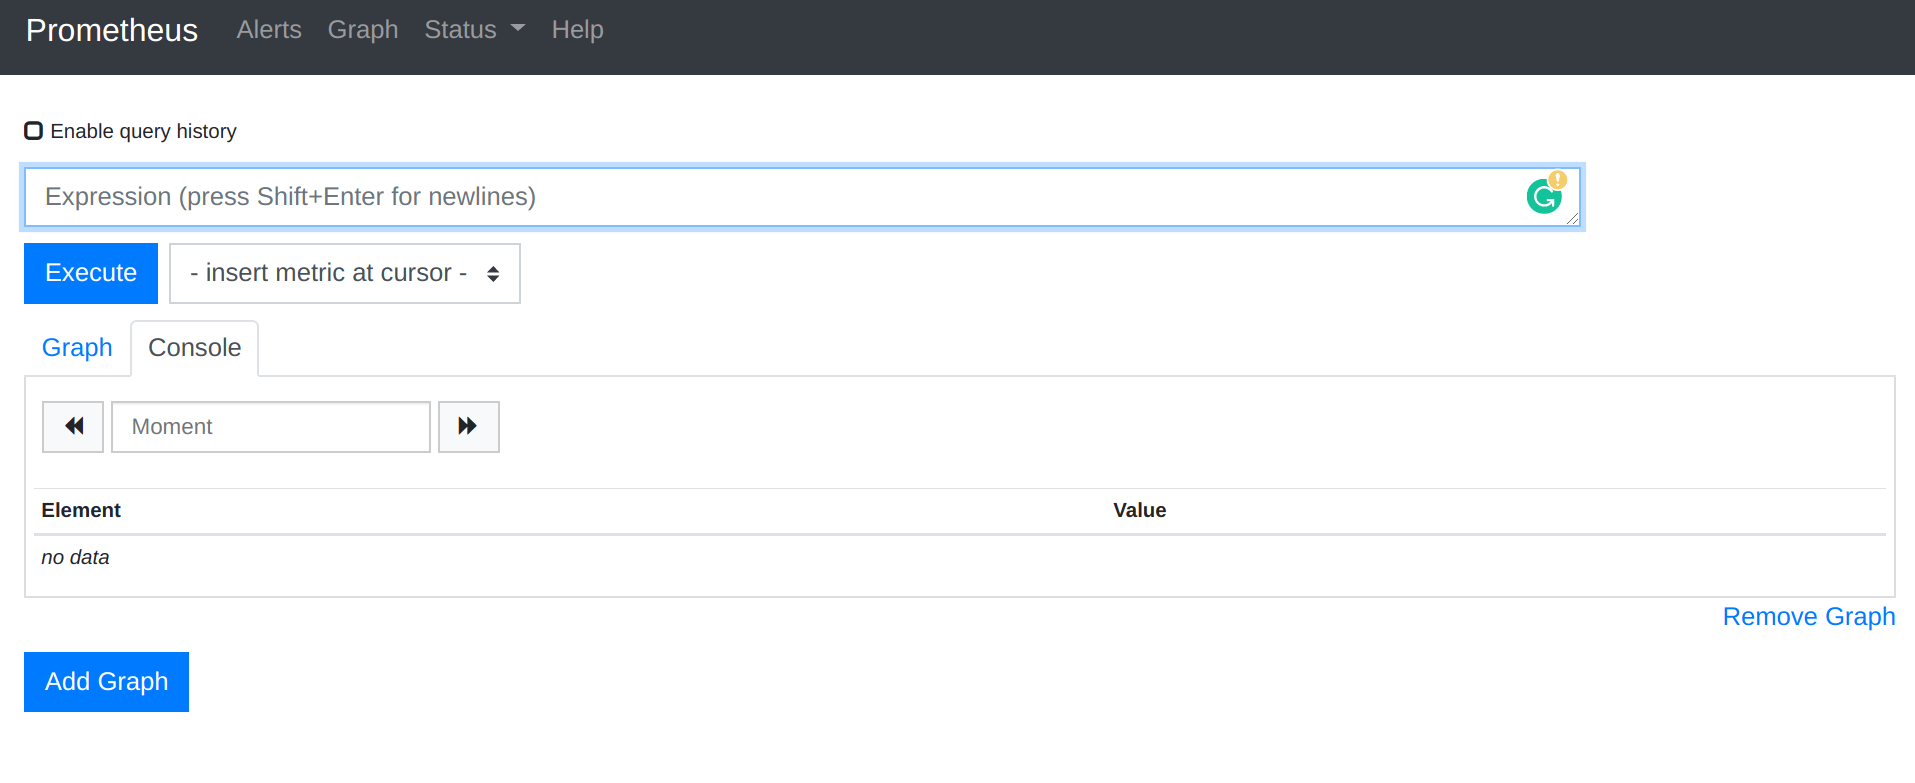
root@grafana:~# 通过 URL http://[ip_hostname]:9090 访问 Prometheus Web 界面。
第6步:安装node_exporter Debian 11/Debian 10
下载node_exporter存档。
curl -s https://api.github.com/repos/prometheus/node_exporter/releases/latest| grep browser_download_url|grep linux-amd64|cut -d '"' -f 4|wget -qi -解压下载的文件并将二进制文件移动到 /usr/local/bin。
tar -xvf node_exporter*.tar.gz
cd  node_exporter*/
sudo cp node_exporter /usr/local/bin
cd
确认安装。
$ node_exporter --version
node_exporter, version 1.5.0 (branch: HEAD, revision: 1b48970ffcf5630534fb00bb0687d73c66d1c959)
  build user:       root@6e7732a7b81b
  build date:       20221129-18:59:09
  go version:       go1.19.3
platform: linux/amd64创建node_exporter服务。
sudo tee /etc/systemd/system/node_exporter.service <<EOF
[Unit]
Description=Node Exporter
Wants=network-online.target
After=network-online.target

[Service]
User=prometheus
ExecStart=/usr/local/bin/node_exporter

[Install]
WantedBy=default.target
EOF
重新加载systemd并启动服务。
sudo systemctl daemon-reload
sudo systemctl start node_exporter
sudo systemctl enable node_exporter
确认状态:
$ systemctl status node_exporter.service
* node_exporter.service - Node Exporter
     Loaded: loaded (/etc/systemd/system/node_exporter.service; enabled; vendor preset: enabled)
     Active: active (running) since Mon 2023-05-22 23:45:06 EAT; 6s ago
   Main PID: 5872 (node_exporter)
      Tasks: 5 (limit: 9303)
     Memory: 2.2M
        CPU: 5ms
     CGroup: /system.slice/node_exporter.service
             `-5872 /usr/local/bin/node_exporter

May 22 23:45:06 grafana node_exporter[5872]: ts=2023-05-22T20:45:06.996Z caller=node_exporter.go:117 level=info collector=thermal_zone
May 22 23:45:06 grafana node_exporter[5872]: ts=2023-05-22T20:45:06.996Z caller=node_exporter.go:117 level=info collector=time
May 22 23:45:06 grafana node_exporter[5872]: ts=2023-05-22T20:45:06.996Z caller=node_exporter.go:117 level=info collector=timex
May 22 23:45:06 grafana node_exporter[5872]: ts=2023-05-22T20:45:06.996Z caller=node_exporter.go:117 level=info collector=udp_queues
May 22 23:45:06 grafana node_exporter[5872]: ts=2023-05-22T20:45:06.996Z caller=node_exporter.go:117 level=info collector=uname
May 22 23:45:06 grafana node_exporter[5872]: ts=2023-05-22T20:45:06.996Z caller=node_exporter.go:117 level=info collector=vmstat
May 22 23:45:06 grafana node_exporter[5872]: ts=2023-05-22T20:45:06.996Z caller=node_exporter.go:117 level=info collector=xfs
May 22 23:45:06 grafana node_exporter[5872]: ts=2023-05-22T20:45:06.996Z caller=node_exporter.go:117 level=info collector=zfs
May 22 23:45:06 grafana node_exporter[5872]: ts=2023-05-22T20:45:06.996Z caller=tls_config.go:232 level=info msg="Listening on" address=[::]:9100
May 22 23:45:06 grafana node_exporter[5872]: ts=2023-05-22T20:45:06.996Z caller=tls_config.go:235 level=info msg="TLS is disabled." http2=false a>一旦我们确认服务正在运行,我们就将node_exporter添加到Prometheus服务器。
sudo vim /etc/prometheus/prometheus.yml在 scrape_config 部分下添加新作业。
scrape_configs:
  # The job name is added as a label `job=<job_name>` to any timeseries scraped from this config.
  - job_name: "prometheus"
    static_configs:
      - targets: ["localhost:9090"]
  - job_name: 'node_exporter'
    static_configs:
      - targets: ['localhost:9100']
重新启动普罗米修斯:
sudo systemctl restart prometheus您现在已经安装了 Prometheus
- 如何使用 Prometheus 和 Grafana 监控 Etcd 集群
- 如何在 5 分钟内使用 Prometheus 和 Grafana 监控 Redis 服务器
- 如何在 5 分钟内使用 Prometheus 和 Grafana 监控 Linux 服务器性能
- 如何在 5 分钟内使用 Prometheus 和 Grafana 监控 Apache Web 服务器
- 如何使用 Prometheus 和 Grafana 监控 BIND DNS 服务器