如何在AlmaLinux 9上安装Prometheus和Node Exporter
Prometheus 是一个开源监控和警报平台。
Prometheus最初是由Soundcloud于2012年创建的。此后,一些著名公司采用的Prometheus项目成为一个更大的项目,拥有非常活跃的开发人员和社区。 2016年,Prometheus项目在云原生计算基金会(CNCF)下毕业。
您必须了解的基本概念
基本上,Prometheus 通过 HTTP 端点从目标服务器收集数据和指标,然后将所有数据存储为时间序列。在 Prometheus 中,时间序列数据通过指标名称和键/值对来标识。
Prometheus 通过 Prometheus 查询语言 (PromQL) 提供灵活性。您可以使用PromQL查询Prometheus时序数据库。
在目标服务器上,您必须安装向 Prometheus 公开所有数据和指标的“导出器”应用程序。 “Node Exporter”是监控 Linux 机器的常用导出器。
节点导出器公开 Linux 计算机中与硬件和内核相关的矩阵。它是一个二进制文件,将向 Prometheus 服务器公开数据端指标。
本指南将向您展示如何在AlmaLinux 9服务器上安装Prometheus和Node Exporter。
先决条件
开始之前请确保您具备以下条件:
- 两台 AlmaLinux 9 服务器 - 本示例将为 Prometheus 和 Node Exporter 使用单独的服务器。
- 非root用户可以执行sudo来获得root权限。
安装和配置普罗米修斯
Prometheus 是一个开源的现代系统监控和警报系统。它可以通过预编译包安装在传统的 Unix/Linux 服务器上,使用 Docker 和 Kubernetes 等容器技术,或 Ansible、Chef、Puppet 和 Saltstack 等配置管理工具。
以下部分向您展示如何通过预构建的二进制文件将 Prometheus 安装到 ALmaLinux 9 服务器。
完成以下步骤以在您的AlmaLinux服务器上成功安装Prometheus:
- 设置用户和目录
- 下载 Prometheus 二进制包
- 配置普罗米修斯服务器
- 作为 Systemd 服务在后台运行 Prometheus
设置用户和目录
在安装 prometheus 之前,您将在系统上创建新用户和目录。该用户将用于运行Prometheus,其中一些目录将用于存储Prometheus配置文件和数据。
运行以下命令创建一个新的系统用户prometheus。
sudo adduser -M -r -s /sbin/nologin prometheus运行以下命令创建一个新目录 /etc/prometheus 用于存储 Prometheus 配置文件,以及目录 /var/lib/prometheus 用于存储 Prometheus 配置文件Prometheus 的数据目录。
sudo mkdir /etc/prometheus
sudo mkdir /var/lib/prometheus
现在运行以下命令将 /etc/prometheus 和 /var/lib/prometheus 目录的所有权更改为用户 prometheus 和组普罗米修斯。
sudo chown prometheus:prometheus /etc/prometheus
sudo chown prometheus:prometheus /var/lib/prometheus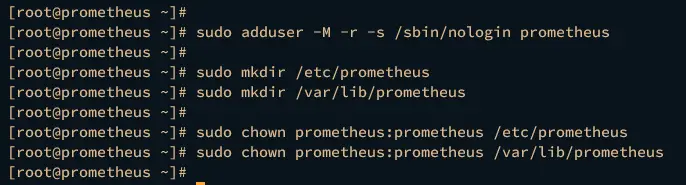
下载Prometheus预编译包
现在,您将在服务器上安装 prometheus。在此演示中,您将通过预编译的二进制包安装 Prometheus。您将在IP地址192.168.10.20的AlmaLinux服务器上安装Prometheus。
运行下面的 dnf 命令将 wget 安装到您的系统。
sudo dnf install wget -y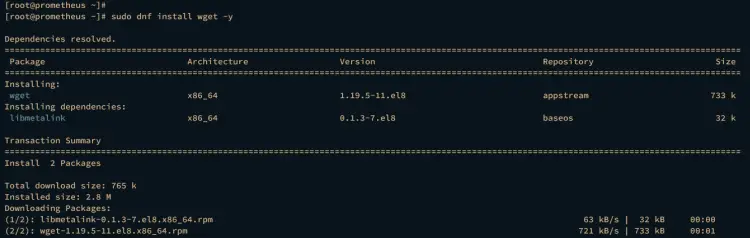
将工作目录移动到/usr/src并通过wget下载Prometheus预编译的二进制文件。
cd /usr/src
wget https://github.com/prometheus/prometheus/releases/download/v2.44.0/prometheus-2.44.0.linux-amd64.tar.gz
现在使用下面的 tar 命令提取 Prometheus 二进制文件 prometheus-2.44.0.linux-amd64.tar.gz。您应该获得一个新目录 prometheus-2.44.0.linux-amd64,其中包含 Prometheus 二进制文件和一些默认配置。
tar -xf prometheus-2.44.0.linux-amd64.tar.gz运行以下命令,将默认的 Prometheus 配置文件 prometheus.yml 和一些重要目录复制到 /etc/prometheus/。
sudo cp /usr/src/prometheus-*/prometheus.yml /etc/prometheus/
sudo cp -r /usr/src/prometheus-*/consoles /etc/prometheus
sudo cp -r /usr/src/prometheus-*/console_libraries /etc/prometheus
之后,使用以下命令将 /etc/prometheus/ 目录的所有权更改为用户 promtheus 和组 prometheus。
sudo chown -R prometheus:prometheus /etc/prometheus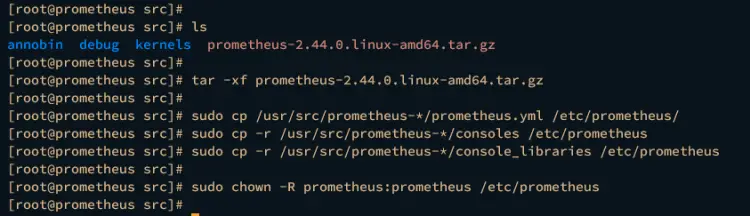
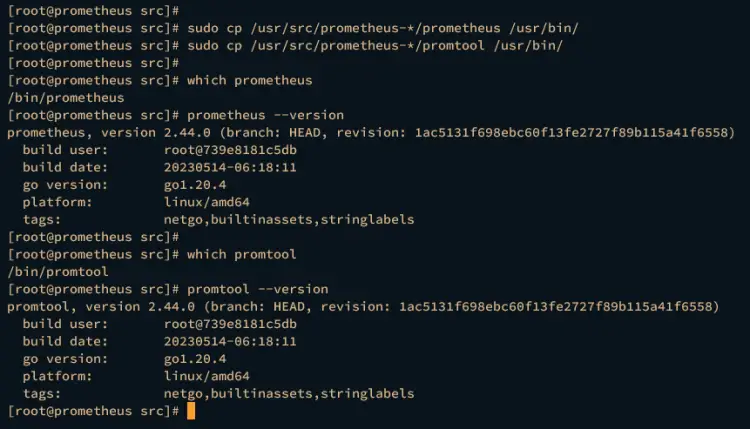
接下来,运行以下命令将prometheus和promtool的二进制文件复制到/usr/bin/目录中。
sudo cp /usr/src/prometheus-*/prometheus /usr/bin/
sudo cp /usr/src/prometheus-*/promtool /usr/bin/
然后,使用以下命令验证 prometheus 和 promtool。
which prometheus
prometheus --version
which promtool
promtool --version如果安装成功,您应该看到 prometheus 和 promtool 命令的完整路径,位于 /usr/bin/ 目录中。您还将看到已安装的 Prometheus 版本。
配置普罗米修斯
下载并安装prometheus后,您将开始Prometheus的基本配置。
使用 nano 编辑器打开 prometheus 配置文件 /etc/prometheus/prometheus.yml。
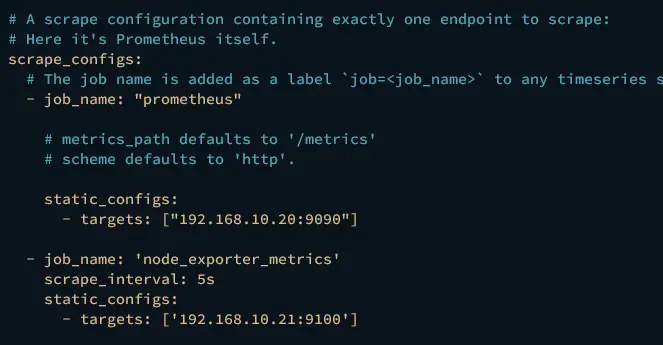
nano /etc/prometheus/prometheus.yml在 scrape_configs 参数中,添加新作业 prometheus 以及 Prometheus 服务器本身的目标。在此示例中,Prometheus 服务器的 IP 地址为 192.168.10.20,这将抓取 Prometheus 的指标。
# A scrape configuration containing exactly one endpoint to scrape:
# Here it's Prometheus itself.
scrape_configs:
  # The job name is added as a label `job=<job_name>` to any timeseries scraped from this config.
  - job_name: "prometheus"
    # metrics_path defaults to '/metrics'
    # scheme defaults to 'http'.
    static_configs:
      - targets: ["192.168.10.20:9090"]
完成后保存并关闭文件。
接下来,使用 nano 编辑器命令为 prometheus 创建一个新的 systemd 服务文件 /etc/systemd/system/prometheus.service。
sudo nano /etc/systemd/system/prometheus.service添加以下配置以将 Prometheus 作为 systemd 服务运行。
[Unit]
Description=Prometheus
Wants=network-online.target
After=network-online.target
[Service]
User=prometheus
Group=prometheus
Type=simple
ExecStart=/usr/bin/prometheus \
    --config.file /etc/prometheus/prometheus.yml \
    --storage.tsdb.path /var/lib/prometheus/ \
    --web.console.templates=/etc/prometheus/consoles \
    --web.console.libraries=/etc/prometheus/console_libraries
[Install]
WantedBy=multi-user.target
完成后保存文件并退出编辑器。
现在运行以下命令来重新加载 systemd 管理器并将更改应用到 systemd。
sudo systemctl daemon-reload然后,使用下面的 systemctl 命令启动并启用 prometheus 服务。
sudo systemctl start prometheus
sudo systemctl enable prometheus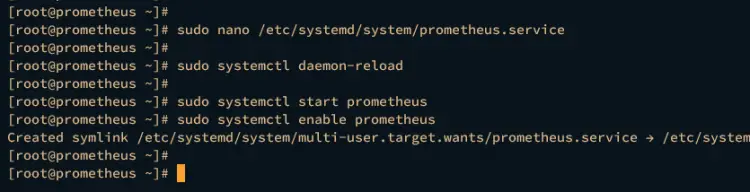
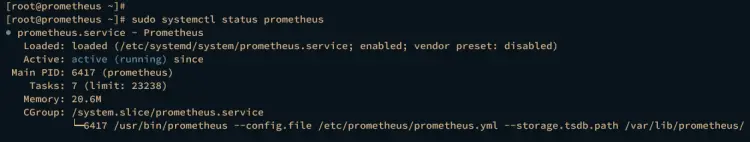
验证prometheus服务,确保该服务正在运行。
sudo systemctl status prometheus如果安装成功,您应该会看到 prometheus 服务状态为活动(正在运行)。
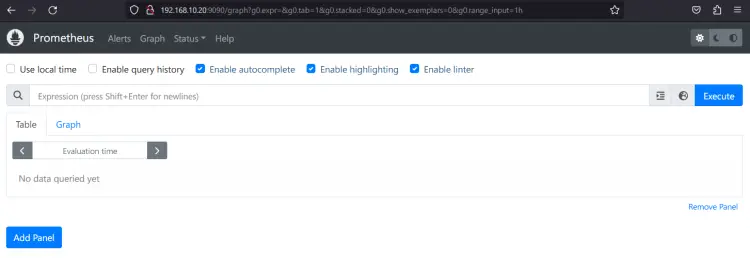
最后,启动您的网络浏览器并访问服务器 IP 地址和端口 9090(即 http://192.168.10:20:9090/)。如果安装成功,您应该得到如下 Prometheus 图表页面:
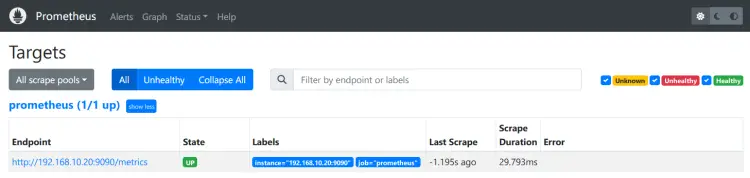
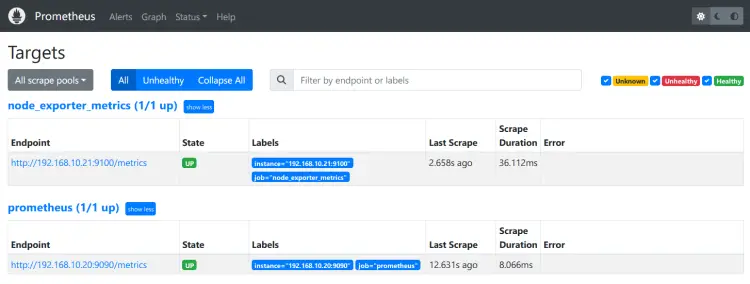
您还可以通过单击状态 > 目标来验证监控端点状态。您应该看到 job_name prometheus 的状态为 UP。
在目标监控上安装和配置 Node Exporter
Node Exporter 是 Prometheus 的一个应用程序,用于公开目标监控的系统指标。它允许您抓取各种系统指标,并可以暴露给 Prometheus 进行进一步处理。
在本节中,您将在 IP 地址为 192.168.10.21 的 AlmaLinux 9 服务器上安装 Node Exporter。您将通过 Prometheus 提供的预编译二进制包安装 Node Exporter。
下载并安装节点导出器
要安装 Node Exporter,您必须为其创建专用的系统用户,并将 Node Exporter 的二进制包下载到您的系统中。
首先,运行以下命令创建一个新的系统用户node_exporter。
sudo adduser -M -r -s /sbin/nologin node_exporter使用下面的 dnf 命令安装 wget。
sudo dnf install wget -y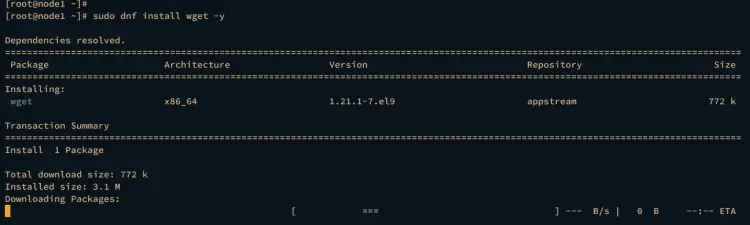
然后,进入/usr/src目录并通过wget下载Node Exporter预编译的二进制文件。
cd /usr/src/
wget https://github.com/prometheus/node_exporter/releases/download/v1.6.0/node_exporter-1.6.0.linux-amd64.tar.gz
下载完成后,您应该会看到文件 node_exporter-1.6.0.linux-amd64.tar.gz。使用下面的 tar 命令将其提取。
tar -xf node_exporter-1.6.0.linux-amd64.tar.gz接下来,使用以下命令将 Node Exporter 的二进制文件移动到 /usr/bin 目录。
mv node_exporter-*/node_exporter /usr/bin现在使用以下命令验证节点导出器。如果成功,您应该获得完整路径二进制路径和 Node Exporter 的版本。
which node_exporter
node_exporter --version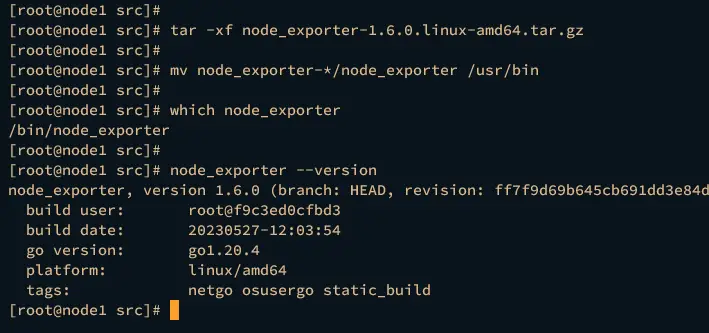
在后台作为服务运行节点导出器
安装 Node Exporter 后,您将在后台将 Node Exporter 设置为 systemd 服务并将其运行。
为此,请使用下面的 nano 编辑器命令创建一个新的 systemd 服务文件 /etc/systemd/system/node_exporter.service。在此示例中,您将把 Node Exporter 作为 systemd 服务运行。
sudo nano /etc/systemd/system/node_exporter.service将以下配置插入到文件中。
[Unit]
Description=Node Exporter
After=network.target
[Service]
User=node_exporter
Group=node_exporter
Type=simple
ExecStart=/usr/bin/node_exporter
[Install]
WantedBy=multi-user.target
完成后保存并退出文件。
现在运行下面的 systemctl 命令来重新加载 systemd 管理器。
sudo systemctl daemon-reload然后使用以下命令启动并启用 node_exporter 服务。
sudo systemctl start node_exporter
sudo systemctl enable node_exporter
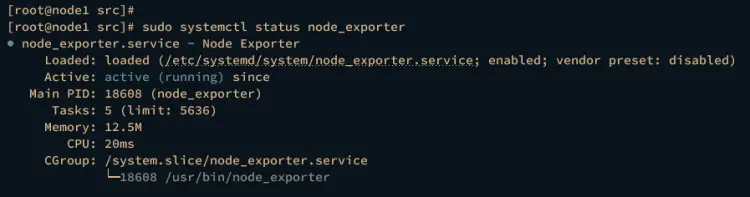
启动并启用 node_exporter 后,运行以下命令对其进行验证并确保该服务正在运行。
sudo systemctl status node_exporter如果正在运行,您应该会看到状态为活动(正在运行)的node_exporter 服务。
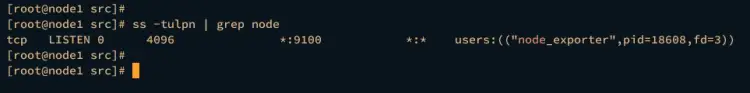
最后,运行以下命令验证 Node Exporter 的端口。默认情况下,它在端口 9100 上运行。
ss -tulpn | grep node您应该看到端口 9100 被 node_exporter 服务使用。
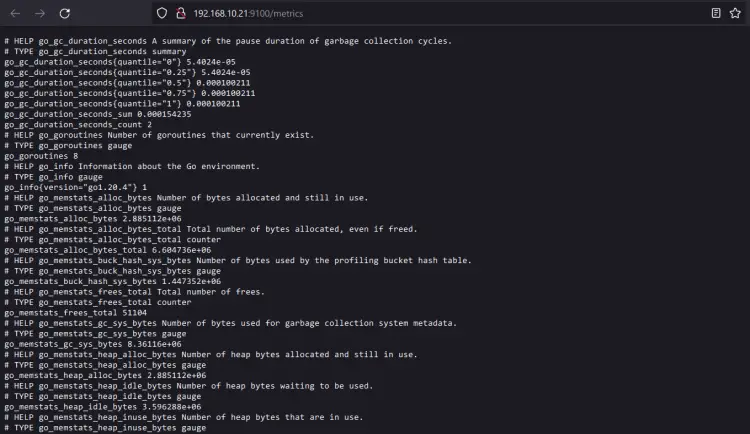
您还可以通过网络浏览器访问服务器 IP 地址和端口 9100(即:http://192.168.10.21:9100/)来验证它。您应该通过 Node Exporter 看到服务器监控的端点数据。
将节点导出器添加到 Prometheus 服务器
在本部分中,您将把 Node Exporter 添加到 Prometheus 服务器。您已经在服务器 192.168.10.21 上安装并公开了系统指标,然后您现在将其添加到在 192.168.10.20 上运行的 Prometheus 服务器。
使用以下 nano 编辑器打开 Prometheus 配置 /etc/prometheus/prometheus.yml。
sudo nano /etc/prometheus/prometheus.yml使用scrape_config参数,添加新的job_namenode_exporter_metrics并输入节点导出器的详细端点。以下示例将监控 IP 地址为 192.168.10.21 的服务器 node1。
  - job_name: 'node_exporter_metrics'
    scrape_interval: 5s
    static_configs:
      - targets: ['192.168.10.21:9100']
完成后保存文件并退出编辑器。
现在运行以下命令来重新启动 prometheus 服务并应用更改。
sudo systemctl restart prometheus现在从 Web 浏览器打开 prometheus,然后单击状态 > 目标以确保添加节点导出器。如果成功,您应该会看到状态为 UP 的作业 node_exporter_metrics。
接下来,移至Graph菜单并输入以node_开头的查询以获取Node Exporter提供的查询列表。
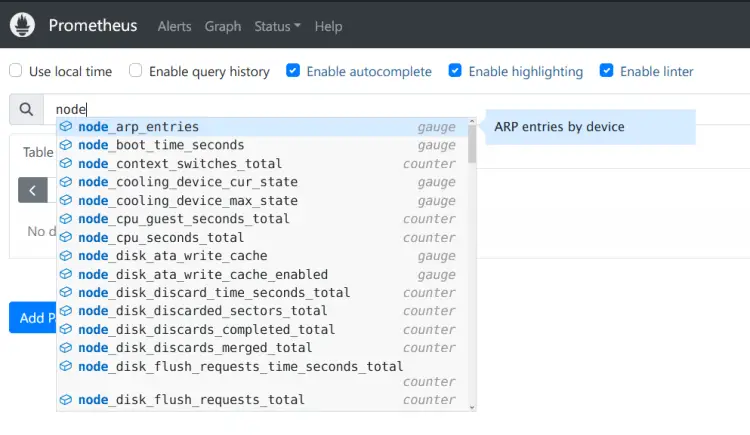
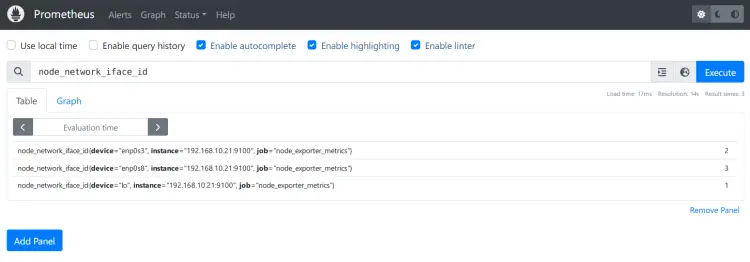
输入查询node_network_iface_id以获取服务器192.168.10.21上的网络设备列表。
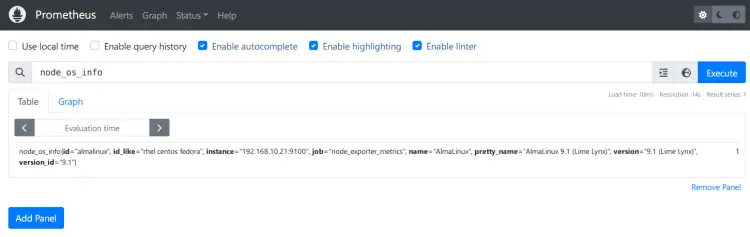
您还可以通过 node_os_info 查询来验证操作系统信息的详细信息。
最后,输入查询node_load15并单击图表选项卡即可获取过去15分钟的系统负载状态。

结论
很棒的工作!您已在AlmaLinux 9服务器上成功安装Prometheus,并通过Node Exporter监控AlmaLinux服务器。
您现在可以监控另一台服务器或通过 Prometheus 导出器监控您的应用程序。您还可以将 Prometheus 与 Grafana 集成,以实现监控系统的可视化。